
Every quarter, the same conversation happens in boardrooms and budget reviews: we funded this many features, and we shipped fewer. Why is the roadmap so slow?
The usual answers are more people, more process, or more pressure. But in a lot of organizations, the problem isn’t speed. The roadmap isn’t slow. It’s leaking.
The gap between funded and shipped
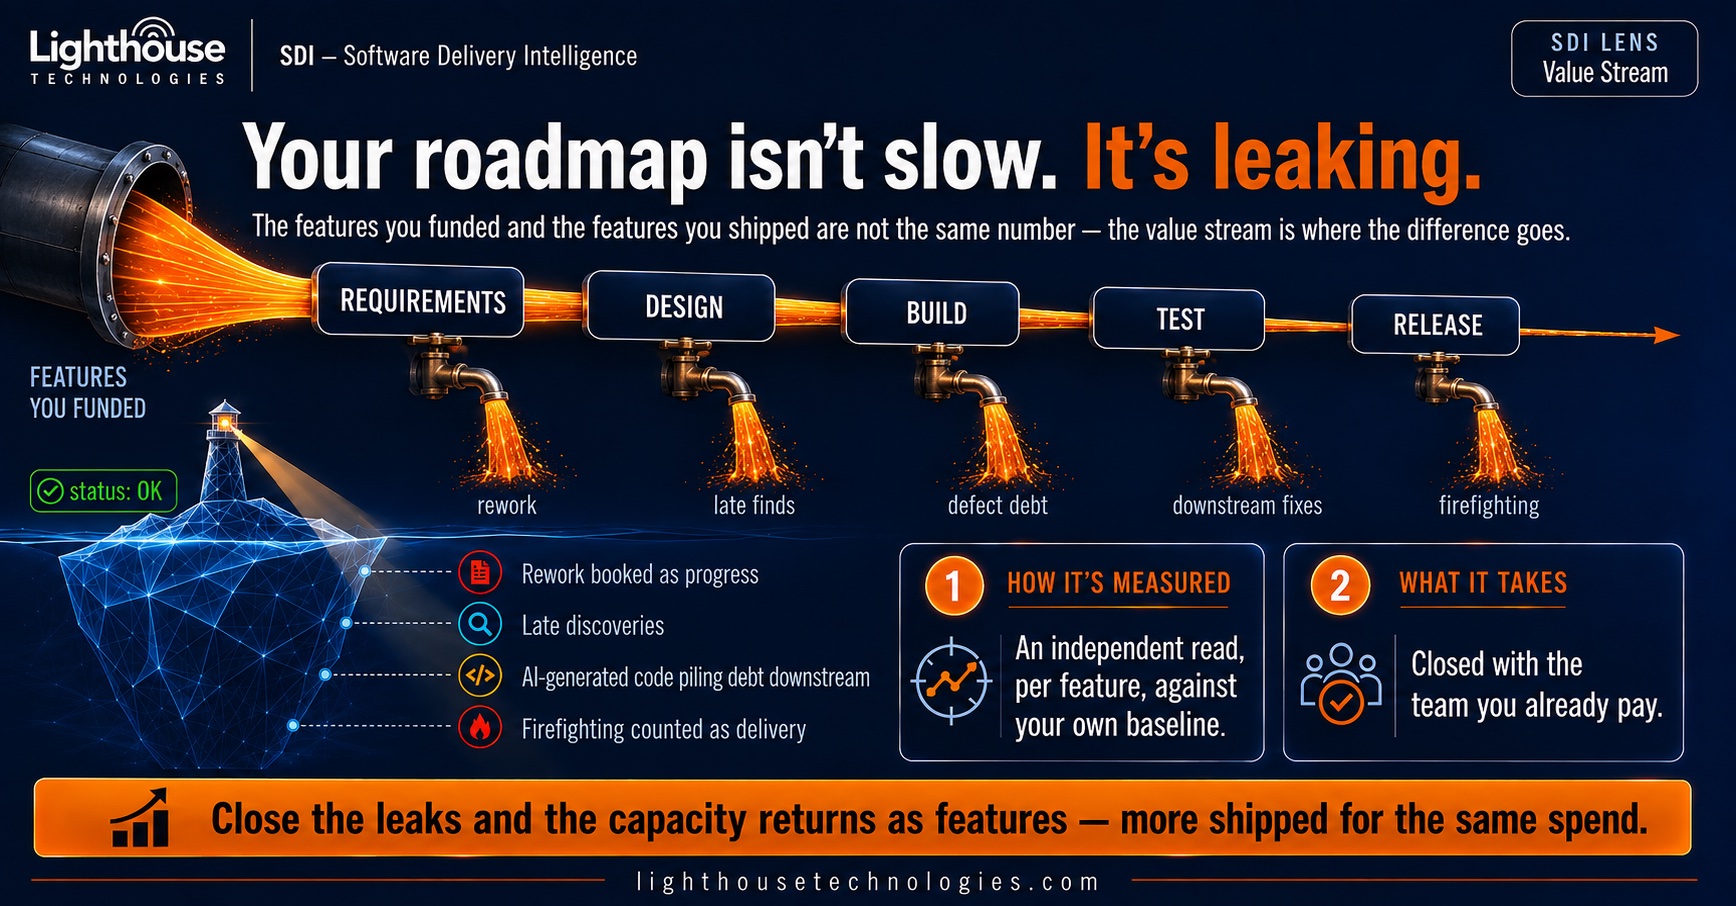
Think of your software delivery process as a pipe. At the front, you pour in the features you funded. At the far end, a smaller number comes out as shipped, working software. The difference doesn’t vanish. It’s consumed along the way, in the value stream.
A typical value stream runs through five stages: Requirements, Design, Build, Test, and Release. At every one of them, a little leaks out:
- Requirements → rework. Ambiguous or shifting requirements send work back to the start.
- Design → late finds. Problems that should be caught on the whiteboard show up later, when they’re expensive.
- Build → defect debt. Defects slip through and pile up, to be paid down later with interest.
- Test → downstream fixes. Testing becomes a place where problems are discovered and patched instead of confirmed absent.
- Release → firefighting. Teams that should be starting the next feature are putting out fires from the last one.
Each leak is small enough to tolerate. Together, they can consume a large share of the capacity you thought you were buying.
What a leak looks like in numbers
It’s easy to nod along with “rework” and “firefighting” in the abstract. It’s harder to know what they cost. So we built a sample Software Risk Assessment that shows our method on a fictional client: an example disc golf retailer’s Pro Shop Portal team, examined across one twelve-week release.
(The client and every figure in the report are invented to illustrate the method. It is not a real assessment.)
The release represented 4,300 hours of funded development capacity. Here’s what the assessment found:
- 890 hours, or 20.7% of that capacity, went to unplanned rework and to work that was built but never shipped. In the sample, that’s about five more features the team could have delivered.
- The release shipped seven of eleven committed features. The date held and the cost held. What moved was scope.
- Velocity never varied by more than 10%, yet 31% of the completed story points were defects and rework, counted exactly like new features.
A date-and-cost report would have called this release a success. Nothing in it would have shown a problem.
Notice what the sample report does not say: that the team is undisciplined. It says the opposite. The team has a real process and follows it, and 94% of defects are caught before customers see them. The leak lives in what the process counts and when it catches problems, not in the people.
Read the sample report executive summary →
Inside the leak: late defects cost the most
In the full sample report, the section titled “It’s leaking” shows where a large share of those hours went. It’s a pattern most teams will recognize: defects created early, found late.
The assessment classified every defect ticket by where it actually originated. 281 defects escaped the phase that created them. Requirements were the weakest link. Roughly three in four requirements problems were found by someone downstream.
The cost of lateness compounds. The report applies industry benchmark cost data:
| Where the defect is finally found | Approximate cost to fix |
| In the phase that created it | ~$250 |
| One phase later | ~$1,250 |
| Two phases later | ~$6,000 |
| In production | up to ~$30,000 |
Even on the most conservative assumption, that every escaped defect was caught in the very next phase, the sample release carries about $281,000 in added cost. The report calls that a floor.
And here’s why this kind of leak goes unnoticed: the team’s cumulative defect removal before release was 94%. It catches almost everything. It just catches it late.
Why you don’t see it
If the leaks are this costly, why do they persist? Because most dashboards say everything is fine. The status reads OK. Underneath, the picture is different:
- Rework booked as progress. In the sample, rework and defects were pointed and counted in velocity exactly like features. Velocity held flat all quarter while the share of points spent on new functionality fell from 85% to 60%. The chart looked healthy while delivery shrank.
- Late discoveries. Issues found at the end of a release don’t announce themselves as waste. They look like normal project turbulence. In the sample, two features were displaced across three consecutive releases and appeared on no escalation list.
- AI-generated code piling debt downstream. AI coding tools have raised the speed of producing code, but faster code isn’t automatically correct, maintainable, or easy to test. There’s little solid data yet on how AI changes where defects get introduced or caught, which is exactly why we baseline your actual numbers instead of assuming the benchmarks still hold.
- Firefighting counted as delivery. Heroic effort to stabilize a release feels like productivity. In reality, it’s the cost of an upstream leak.
There’s one more reason, and it may be the most important. In the sample, leaders and the team did not see the same organization. On every one of six candor and safety questions, leaders scored more than a point higher than the people doing the work. On “If I found a defect late in a release, I would report it even if it delayed the release,” leaders averaged 4.4 and the team 2.1. When people are reluctant to report late defects, those defects don’t get counted, so every defect figure in the report is a floor. The real numbers are worse.
None of this is a failure of effort or talent. It’s a failure of visibility. Traditional reporting counts what teams did, not what actually reached customers as finished value.
How the leaks get measured
You can’t close a leak you can’t see. That’s the idea behind Lighthouse Technologies’ SDI (Software Delivery Intelligence) Value Stream lens.
It starts with an independent read, per feature, against your own baseline. Not an industry benchmark that may not fit your context, and not a self-reported status from the teams doing the work.
The sample report also shows how to keep the numbers honest. Every figure carries one of three labels: measured from your own delivery record, inferred where you don’t record the data (with the assumption stated), or client-stated by your people and not independently verified. Inferred hours sit beside the headline figure, never inside it. A leak figure you can defend is worth more than a bigger one you can’t.
What it takes to close them
Here’s the part that surprises most leaders: closing the leaks doesn’t require a reorganization, a new vendor team, or new hires.
It’s closed with the team you already pay.
The sample report’s recommendations start with three changes that cost nothing:
- Report committed versus delivered scope every sprint. The displacement in the sample was visible in the team’s own data from week four and reported to no one.
- Separate rework and defect points from feature points in velocity. Until that’s split, the number misleads everyone reading it.
- Tag the phase of origin at defect triage. One field turns the biggest inferred figures into measured ones.
After that, the work is root cause: is late detection a requirements problem, a test-capacity problem, or a handoff problem, and in what proportion? That tells you what to fix first, so improvement is prioritized by impact, not by whoever shouts loudest.
It’s also worth being honest about what any single fix can and can’t do. In the sample, better process maturity would address only about two-fifths of the 890 hours. The rest, such as built-but-never-shipped work and queues and handoffs, takes different work. A program sold as the answer to everything wouldn’t survive contact with your data.
The payoff
Capacity that was disappearing into rework, late finds, defect debt, downstream fixes, and firefighting doesn’t need to be replaced. It needs to be recovered. In the sample, recovering those 890 hours alone would lift productivity by roughly 25%, with no change in headcount, tooling, or hours worked.
Close the leaks and the capacity returns as features: more shipped for the same spend.
Where to start
If your roadmap feels slower than your investment suggests, the question to ask isn’t “how do we make the team go faster?” It’s “where is the work going?”
See what an assessment looks like. Read the executive summary of our sample risk assessment report, then get the full version to see the “It’s leaking” section for yourself.
Read the sample report →
Ready to see your own numbers? Talk to Lighthouse Technologies about a Software Risk Assessment for your team, the first step into Software Delivery Intelligence.
Start the conversation →

Sarah Roberts is the Marketing Specialist at Lighthouse Technologies where she leads marketing strategies and conducts market research within the tech industry. A 2021 graduate of Miami University, Sarah brings a fresh, innovative perspective to industry trends and best practices. Her engaging and relatable blogs simplify complex topics, making them accessible and enjoyable for readers of all backgrounds.